By Brantley Scott
The United States has been gripped by the COVID-19 pandemic for most of 2020. In Utah, the number of cases and hospitalizations have increased markedly over the last few months. The winter months and colder weather usually correspond with rising flu cases. This year, our healthcare system anticipates battling two competing challenges: COVID-19 and the seasonal flu. While a vaccine for COVID-19 is not widely available yet, the flu vaccine is. Each year, public health officials encourage Utahns to get the flu vaccine to avoid illness, hospitalization, and death caused by the seasonal flu. This year, more than ever, it is crucial to limit preventable illness and hospitalization due to the flu. Getting a flu shot is one way to help you and those around you reduce the severity of illness caused by seasonal flu.
The overarching question is, in light of the pandemic, where do Utah’s flu vaccination numbers currently stand? In this DataByte, Utah’s All Payer Claim Database (APCD) 2020 vaccination data trend is compared with the 2019 vaccination data trend[1]. The APCD contains all claim data processed by participating carriers, including most insurance providers as well as Medicaid and Medicare Part C data. This accounts for roughly 67% of the Utah population.
The flu vaccine can be received across many different settings. For simplicity, in this descriptive analysis of the Utah APCD, if the flu vaccination codes were reported on a medical claim, then it was classified as being received in a medical setting, and those reported on pharmacy claims as received in a pharmacy setting. Flu vaccines received that did not generate a claim of any type, such as cash pay or free vaccinations, are not included in this snapshot of the APCD. The figure below illustrates the 2020 weekly number of flu vaccines given in a medical setting was fairly similar to the number reported to the APCD in 2019, until October. At that point, a leveling off and early decrease in the number of flu shots received is observed.
Figure 1. Number of people in Utah APCD receiving flu vaccines in medical settings, 2019-2020
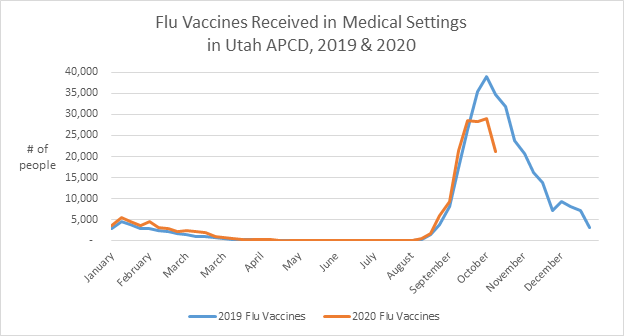
Source: Utah All Payer Claims Database
However, the good news is the number of people receiving the flu shot in pharmacy settings began earlier in 2020 and has remained higher when compared with the same period in 2019. The following graph depicts the seasonal uptick in the weekly number of people receiving the flu vaccine in pharmacy settings.
Figure 2. Number of people in Utah APCD receiving flu vaccines in pharmacy settings, 2019-2020
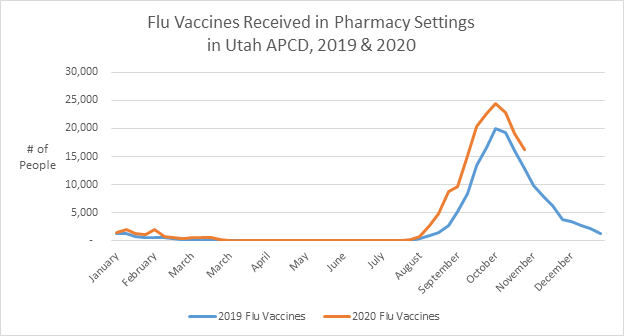
Source: Utah All Payer Claims Database
When combining the two figures into cumulative counts of people who received the flu vaccine, the numbers suggest there were slightly more vaccines reported in the APCD for 2020 than for 2019. Moreover, the gap between the two lines appears to be narrowing.
Figure 3. Cumulative number of people in Utah APCD receiving flu vaccines, 2019-2020
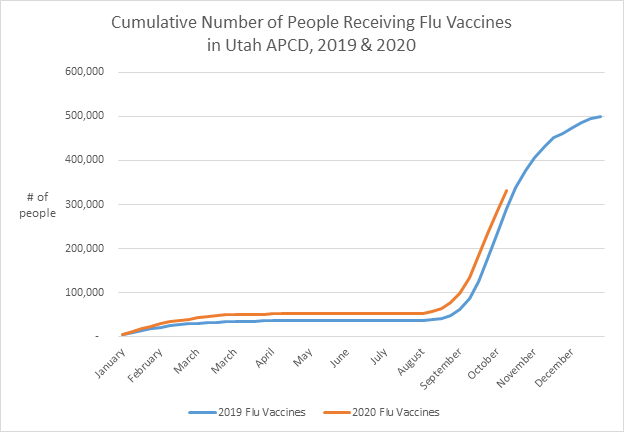
Source: Utah All Payer Claims Database
While the above figures represent aggregate counts, they don’t tell the complete story of how Utahns fare across various patient characteristics. When these data are broken down into age groups, a different trend emerges. The following figures illustrate the weekly number of children (Figure 4) and adult (Figure 5) members receiving the flu vaccine, from August 1st onward, for both 2019 and 2020.
Figure 4. Cumulative number of children in Utah APCD receiving the flu vaccine, by age groups, 2019-2020. Blue line reflects 2019 trends, 2020 in orange.
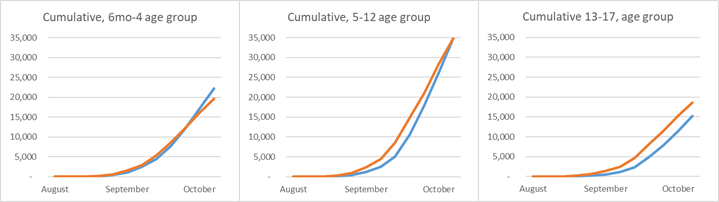
Source: Utah All Payer Claims Database
Figure 5. Cumulative number of adults in Utah APCD receiving the flu vaccine, by age groups, 2019-2020. Blue line reflects 2019 trends, 2020 in orange.
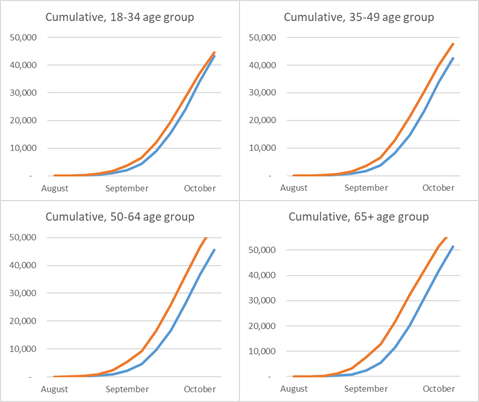
Source: Utah All Payer Claims Database
While it appears many age groupings have a higher number of flu vaccinations reported in 2020 than in 2019, there are a few groups that did not follow this pattern and have lower flu vaccination numbers than in 2019. The six months to four-year-old age group had a lower number of vaccines received this year compared with 2019. The five to twelve-year-old age group shows a similar trend toward the end of October. Given the current data available, there were approximately 2,600 fewer vaccines given to the 6 months to four-year-old (pediatric) age group in 2020 compared with 2019. It is unknown why these two age groups don’t follow the same trend as the other age groups. One possible explanation for this lower than expected vaccination count for children reported to the APCD could be the result of, but not limited to, hesitation to schedule appointments in traditional medical settings, pandemic concerns, personal constraints, and financial limitations, among other factors.
For those who do not wish to get a flu shot for their children or themselves in traditional medical settings during times of locally high COVID-19 transmission, there are a number of options. These include getting the flu shot at a pharmacy, drive-through clinic, after-hours clinic, or a local health department. For more information on the current flu season, visit the Centers for Disease Control and Prevention (CDC) website. To locate a flu vaccination site, VaccineFinder is an excellent resource.
It is especially crucial for young people to get the flu shot, not only because they can become very ill from the seasonal flu, but they may be inadvertently contributing to the spread of the flu among their families and within their communities.
Based on past survey data collected by the National Immunization Survey (NIS)[2] during the 2018/2019 & 2019/2020 flu seasons about 75% of children ages six months to four years usually get the flu shot, while approximately 50% of children in the five to seventeen age group received the flu shot.
For the adult population, traditionally the percentage of those vaccinated is notably lower than the pediatric population. According to the Behavioral Risk Factor Surveillance System (BRFSS)2 conducted during the 2018/2019 and 2019/2020 flu seasons, most Utahns between the ages of 18 and 65 did not receive the flu shot. The decision to not get the annual flu shot may result in excess and avoidable hospitalizations in Utah each year. Based on the observable increase in flu vaccines received among adults in the 35+ age group, it is hoped more adults are going the extra mile to protect themselves and their loved ones, which in turn, helps protect communities and neighborhoods. Another encouraging finding from the NIS and BRFSS surveys is the vaccination rate among Utahns appears to be going up slightly year to year.
Figure 6. Seasonal flu vaccine rates, 2018/2019 & 2019/2020 seasons, by sex and age groups
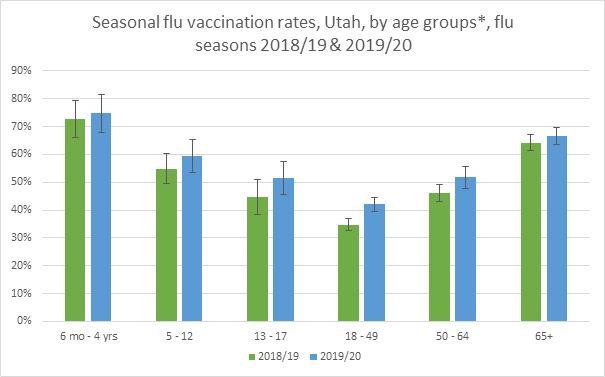
* Data for pediatric (<18 years) age groups drawn from the National Immunization Survey-Flu (NIS-Flu). Data for adult age groups drawn from the Behavioral Risk Factor Surveillance Survey (BRFSS).
In the state of Utah, over the past five flu seasons, there were an average of approximately 1,600 flu-related hospitalizations each year[3]. During a time when Utah’s collective hospital ICU capacity is reaching its limit (more than 90% – December 2020)[4], every flu-related hospitalization that can be avoided, should be avoided. Getting the flu shot is one simple way to help keep those potentially avoidable hospitalizations from occurring, keep our friends, colleagues and families safe, and ensure our state’s healthcare providers can continue to deliver care to those who need it most.
[1] Due to population growth and Medicaid expansion the 2020 APCD population is roughly 4% greater than the 2019 APCD population.
[2] https://www.cdc.gov/flu/fluvaxview/reportshtml/trends/index.html
[3] http://health.utah.gov/epi/diseases/influenza/surveillance/2019-2020/Utah_Weekly_Influenza_Report.html#influenza-associated-hospitalizations
[4] https://coronavirus.utah.gov/case-counts/ (Hospitalizations & Mortality tab), 12/14/2020